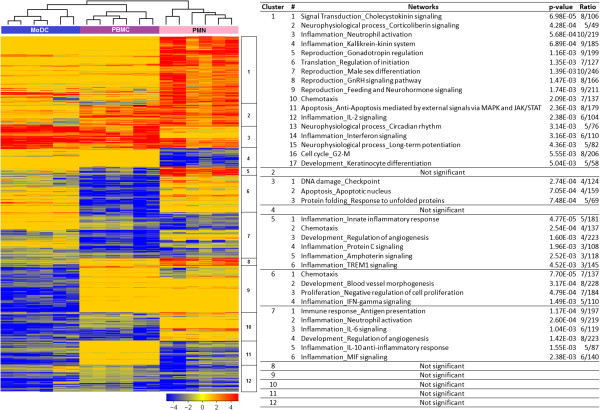
Figure 3.
Transcriptional programs elicited by septic plasma in three reporter cell systems. Six samples, which provided the highest and most consistent response in all three reporter cell systems were selected (Additional file 5). Transcripts passing a filter criterion of 2 fold-change compared to medium controls were used (n = 1,366). Transcripts were organized by hierarchical clustering (Euclidean distance) according to similarities in expression profiles. Each row represents a transcript and each column an individual sample. The heatmap shows fold-change compared to unstimulated cell cultures. Red indicates over-expressed and blue indicates under-expressed transcripts. Clusters are identified by a number on the right side of the heatmap. Each cluster was annotated using the GeneGo MetaCore pathway analysis tool. P-values indicate enrichment significance for the networks based on hypergeometric distribution. Ratios indicate the number of molecules in the query set over the total number of molecules in the network.

