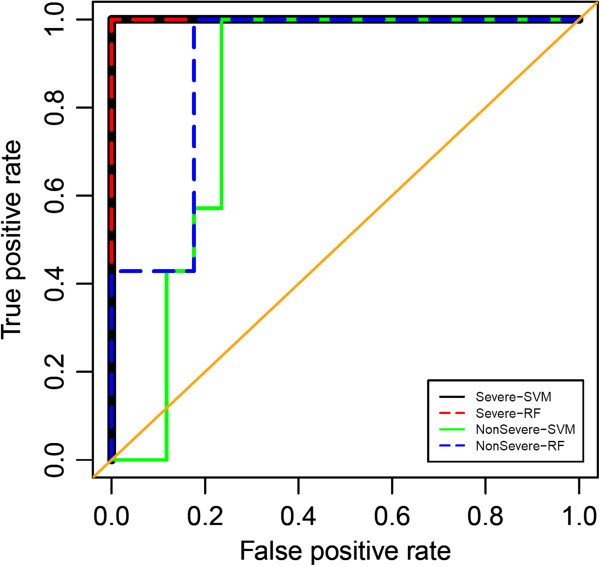
Figure 5.
Receiver operating characteristic (ROC) curve for the candidate septic severity biomarker signature. This plot assesses the performance of the “septic severity” signature in predicting severe sepsis and non-severe sepsis. Areas under the curve (AUC) are 1 for the prediction of severe sepsis by both SVM and RF. AUCs are 0.82 (95% confidence interval, 0.78-1.00) and 0.90 (95% confidence interval, 0.66-0.99) for the prediction of non-severe sepsis by SVM and RF, respectively.

