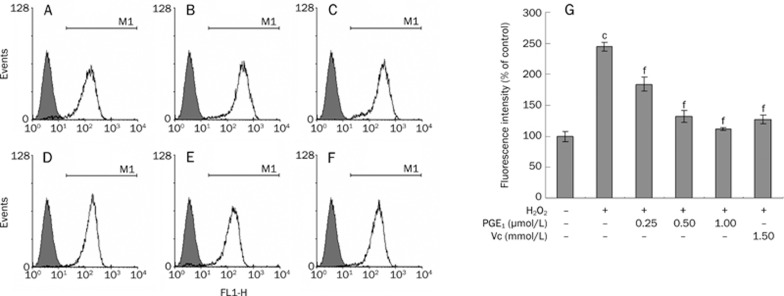
Figure 3.
Effects of PGE1 on the production of intracellular ROS was determined by measuring the intensity of DCFH fluorescence. (A) Control group; (B) H2O2-alone group; (C) H2O2+0.25 μmol/L PGE1 group; (D) H2O2+0.50 μmol/L PGE1 group; (E) H2O2+1.00 μmol/L PGE1 group; (F) H2O2+1.5 mmol/L Vc group; (G) Effects of PGE1 on the production of intracellular ROS. The values are expressed as percentages of the fluorescence intensity. Mean±SD. n=4. cP<0.01 vs control group; fP<0.01 vs the H2O2-alone group.

