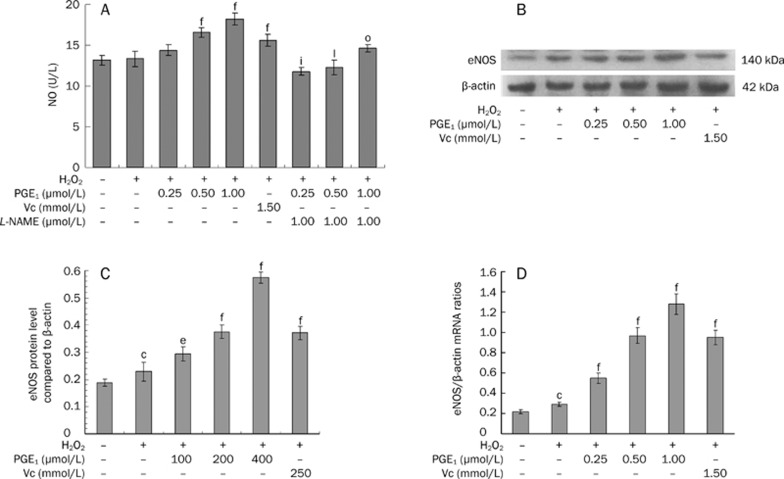
Figure 6.
Effects of PGE1 on NO release (A), eNOS protein (B, C) and mRNA expression (D). Values are expressed as mean±SD. n=6. (A) fP<0.01 vs the H2O2-alone group; iP<0.01 vs the H2O2+0.25 μmol/L PGE1 group; lP<0.01 vs the H2O2+0.50 μmol/L PGE1 group; oP<0.01 vs the H2O2+1.00 μmol/L PGE1 group. (C, D) cP<0.01 vs the empty control group; eP<0.05, fP<0.01 vs the H2O2-alone group.

