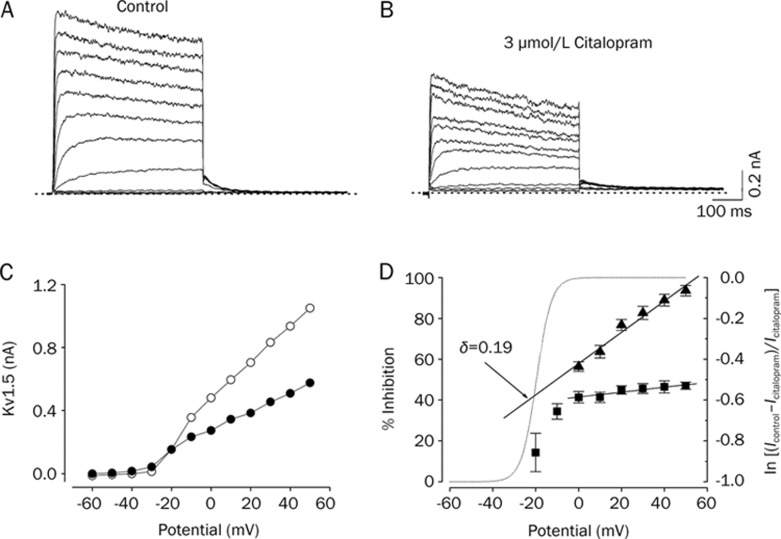
Figure 2.
Voltage dependence of citalopram-induced inhibition of Kv1.5 currents. The Kv1.5 currents were produced by applying 250-ms pulses between −60 and +50 mV in 10-mV increments followed by a 250-ms repolarizing pulse to −40 mV every 10 s, from a holding potential of −80 mV under control conditions (A), and after the addition of 3 μmol/L citalopram (B). The dotted lines in (A) and (B) represent zero current. (C) Resultant I-V relationships taken at the end of the test pulses in the absence (open circle) and presence (closed circle) of 3 μmol/L citalopram. (D) Percentage current inhibition (closed square) from data in (C) was plotted against the membrane potential. For potentials positive to 0 mV, the data of percentage current inhibition was recalculated by using ln{(Icontrol–Icitalopram)/Icitalopram} (closed triangle) and replotted against membrane potential. The voltage dependence was linear fitted with equation 5 (see Materials and methods), shown by the solid line with the indicated values for the equivalent electrical distance (δ=0.19±0.02, n=4). The dotted line represents the activation curve of Kv1.5 under control conditions, which was obtained from a deactivating tail current amplitude at −40 mV after 250-ms depolarizing pulses to potentials between −60 to +50 mV in steps of 10 mV from a holding potentials of −80 mV and thereafter normalization using equation 2 (see Materials and methods). Data are expressed as mean±SEM.

