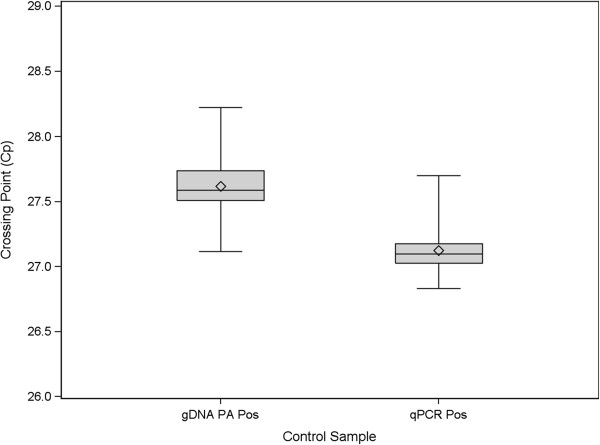
Figure 4.

Boxplots of genomic DNA detection and qPCR positive controls. Boxplots summarizing the performance of genomic DNA detection and qPCR positive controls over Analytical and Clinical Validation. The box represents the inter-quartile range, the line in the box represents the median and the diamond is centered at the mean. The whiskers represent minimum and maximum values observed.
