
Figure 4.
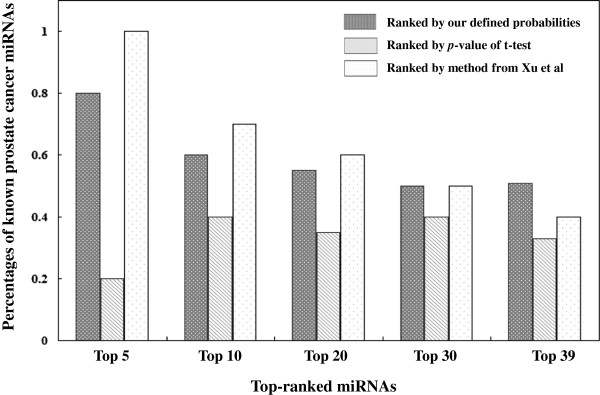
Performance comparison of the prediction of prostate cancer miRNAs. This figure summarizes the performance comparison of three PCa miRNA prediction methods – miRNA expression fold-change obtained by the t-test based method, the cancer miRNA synergism theory based method, and our integrative probability based method. The y-axis represents the percentage of known PCa abnormal miRNAs in the top ranked miRNA sets, and the x-axis indicates the top ranked miRNAs from these three approaches.