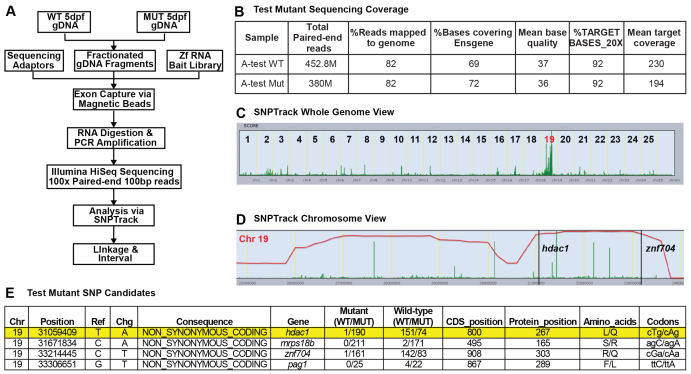
Fig. 1.
Development of a pipeline for the isolation of zebrafish mutations via whole exome sequencing (WES). (A) Flow diagram of our WES approach. (B) Sequencing statistics. (C) Genome view of linkage analysis using SNPtrack. (D) Homozygosity interval showing two candidate mutations. (E) The four candidate mutations for the test mutant. The T-to-A change encoding an L-to-Q missense mutation in hdac1 is highlighted in yellow.

