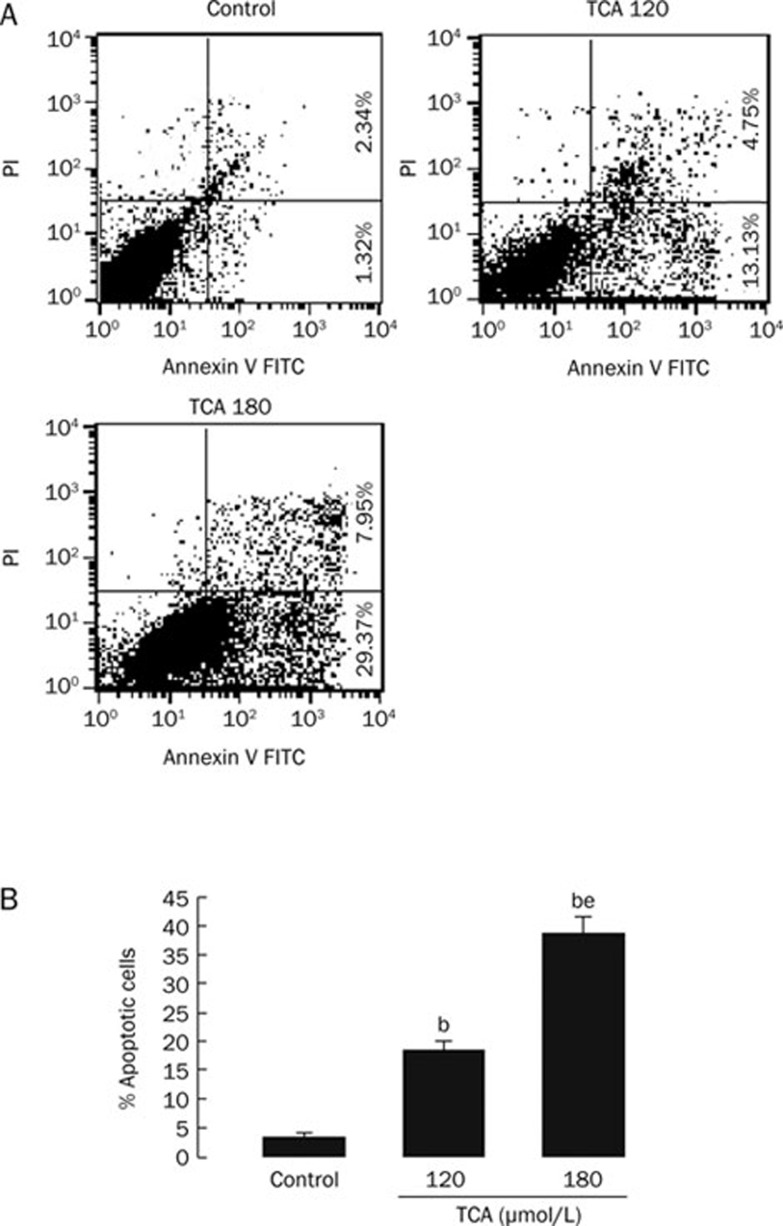
Figure 2.
TCA induced significant apoptosis in K562 cells in a dose-dependent manner at 24 h. A) Original flow cytometry data. Medium supplemented with 0 μmol/L TCA (Control); Medium supplemented with 120 μmol/L TCA (TCA 120); Medium supplemented with 180 μmol/L TCA (TCA 180). B) Percentage of apoptosis in K562 cells. n=6. Mean±SD. bP<0.05 vs Control. eP<0.05 vs 120 μmol/L TCA.

