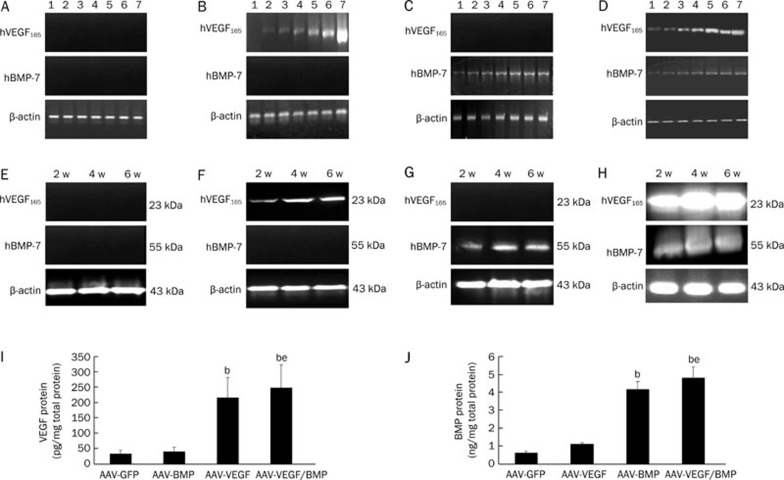
Figure 3.
Expression of hVEGF165 and hBMP-7. (A–D) Representative images of RT-PCR assay of AAV-GFP group (A), AAV-VEGF group (B), AAV-BMP group (C) and AAV-VEGF/BMP group (D). The size of the PCR products for hVEGF165, hBMP-7, and β-actin were 600 bp, 1300 bp, and 340 bp, respectively. With prolonged infection time, the brightness of the VEGF165 or BMP-7 bands increased in AAV-VEGF/BMP group. No hVEGF165 or hBMP-7 band could be detected in AAV-GFP group. Track 1–7 stands for the 1st, 2nd, 3rd, 7th, 14th, 21st, and 28th days post-transfection. (E–H) Representative images of Western blotting assay of AAV-GFP group (E), AAV-VEGF group (F), AAV-BMP group (G) and AAV-VEGF/BMP group (H). The molecular weights of hVEGF165, hBMP-7, and β-actin were 23 kDa, 55 kDa and 43 kDa respectively. Strong staining with the expected molecular weight was observed in AAV-VEGF/BMP group, and no hVEGF165 or hBMP-7 band was observed in AAV-GFP group. (I) ELISA assay for VEGF protein expression. The data is expressed as the mean±SD from three independent experiments. bP<0.05 vs AAV-GFP group, eP<0.05 vs AAV-BMP group. (J) ELISA assay for BMP protein expression. The data is expressed as the mean±SD from three independent experiments. bP<0.05 vs AAV-GFP group. eP<0.05 vs AAV-VEGF group.

