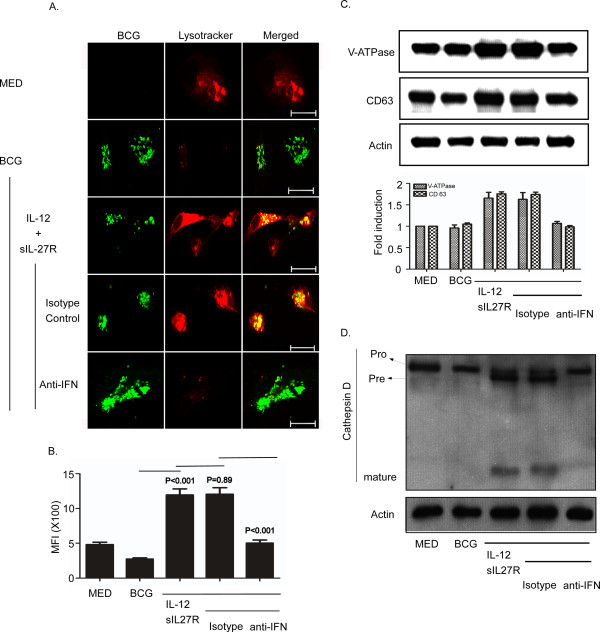
Figure 7.
IFN-γ is required for phagosomal acidification during treatment with IL-12 and sIL-27R. Macrophages were treated with IL-12 and sIL-27R in the presence or absence of isotype control or IFN-γ neutralizing antibodies for 6 h prior to infection with SYTO-9®-stained BCG for 48 h. (A, B) Lysotracker (100 nM) was added in the last hour of infection. Samples were subsequently fixed with 4% PFA. (A) The images shown are representative of typical results in three experiments. (B) The MFI was analyzed as described in the Methods section and represents data from three combined experiments. A student’s t test was used to establish statistical significance in the 95% confidence interval between individual sample groups as indicated. (C, D) Cells were lysed to collect whole-cell lysates for immunoblot analysis (upper panel). (C) V-ATPase, CD63, or actin was labeled as described in the Methods section. An image representative of three experiments is shown. The ratio of proteins/actin band intensity was expressed relative to medium alone (lower panel). Data plotted here are the result of two combined experiments. (D) Cathepsin D or actin was labeled as described in the Methods section. Pro; procathepsin D (52 kDa), Pre; Precathepsin D (48 kDa), mature; mature cathepsin D (approximately 24 kDa). An image representative of two experiments is shown.

