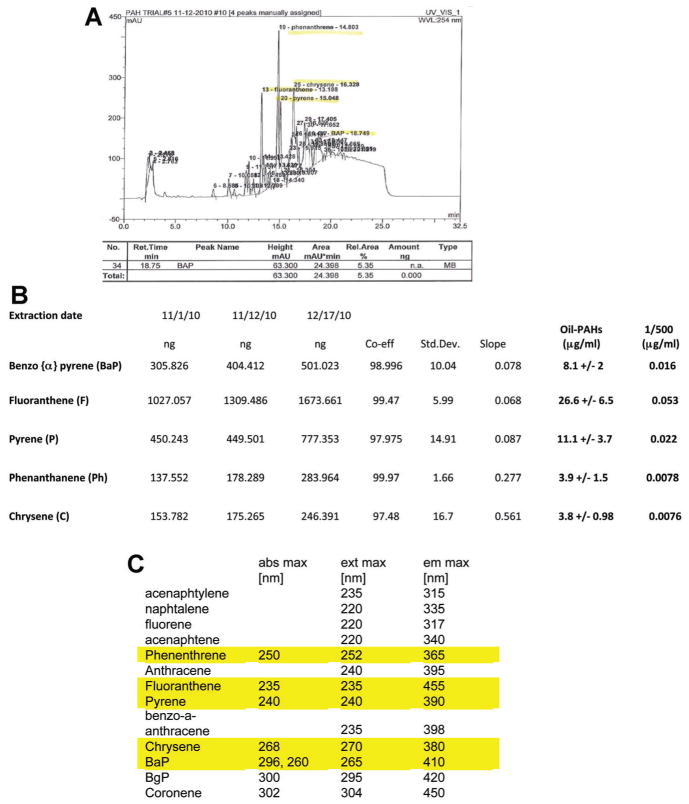
Fig. 1.
High performance liquid chromatography (HPLC) of DMSO extracts from 2010 Deepwater Horizon oil spill in the Gulf of Mexico. Part A: The histogram of DMSO extract of natural crude oil generated by HPLC. The obtained peaks of the oil-PAHs were identified and quantified by comparing their retention times, spectra, and concentrations with a collection of 13 standard PAHs (Part C), which were separated at the same HPLC conditions. Part B: Quantification of the oil-PAHs using three independent DMSO extractions of the same sample of natural crude oil. Each DMSO fraction contained five major peaks, which correspond to the indicated carcinogenic PAHs. Data represent average concentrations ± standard deviation (SD) from three separate extractions in triplicate (n = 9).

