
Figure 2.
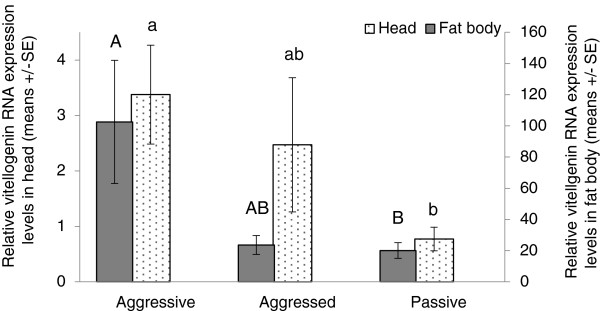
The effect of aggression on the relative vg RNA expression levels in queenless groups. Callow workers were kept in seven worker groups for 4 days. The “aggressive” individual was the most dominant worker that performed the highest number of aggressive behaviors during days 3-4; the “aggressed” individual was the worker that received the highest number of aggressive behaviors; and the “passive” worker performed and received the lowest number of aggressive behaviors per group. Each group was composed of full sisters originating from a different colony (except for one, n = 15 groups, 14 colonies). The relative amounts of vg in the heads were tested in all 15 groups and in the fat body in 5 groups. Data are presented as means ± SE. Different letters above the columns represent statistical differences at α = 0.05.