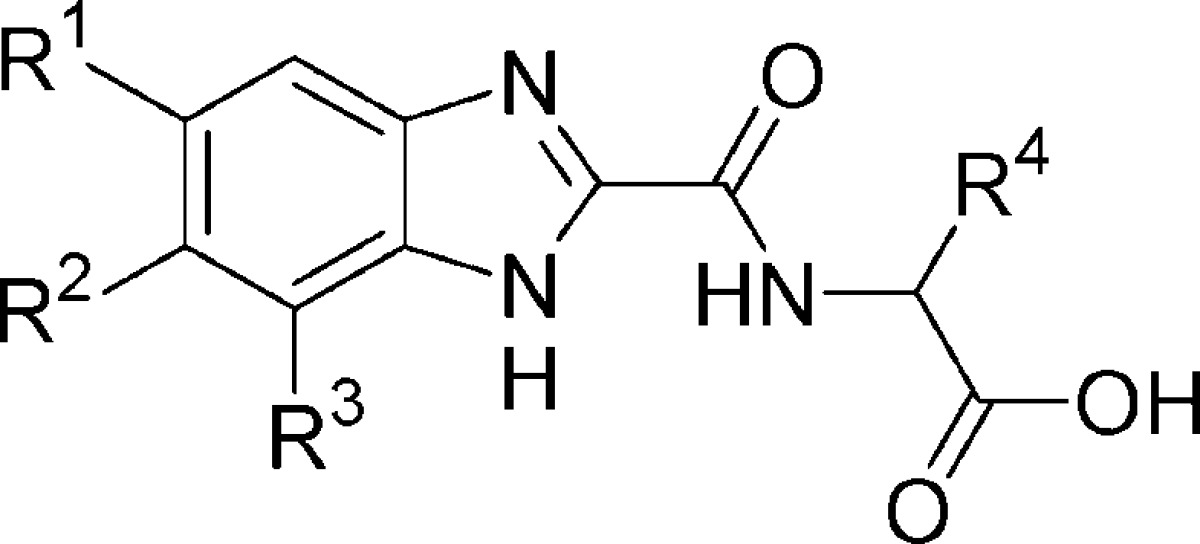
Table 1. PHD2 Enzyme Inhibition and Epo Release in Hep3B Cells for Compounds 3a−h.

| compd | R1 | R2 | R3 | R4 | pIC50a | epo release (%)b |
|---|---|---|---|---|---|---|
| 3a | H | H | H | H | <4 | <20 |
| 3b | Cl | Cl | H | H | 4.9 | <20 |
| 3c | Br | H | H | H | 4.6 | <20 |
| 3d | F | H | H | H | <4 | <20 |
| 3e | OMe | H | H | H | 4.3 | <20 |
| 3f | CF3 | H | CF3 | H | 4.7 | <20 |
| 3g | CF3 | H | CF3 | (S)-Me | 4.3 | <20 |
| 3h | CF3 | H | CF3 | (R)-Me | 4.1 | <20 |
Negative logarithm of the concentration required to achieve 50% enzyme inhibition; the value is ±0.3 log units.
Percent increase in epo release from Hep3B cells at 100 μM concentration relative to positive control measured at 24 h. See the Supporting Information for assay details.
