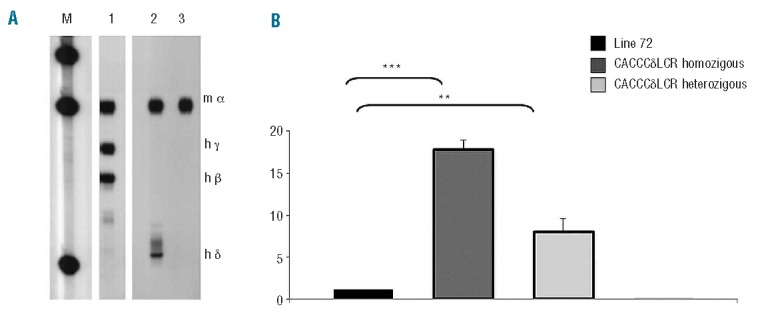
Figure 3.

Determination of δ-globin gene expression level. (A) S1 nuclease protection analysis of 12.5 day pc fetal liver RNA from transgenic line 72 as a positive control for δ-globin gene expression (lane 1), transgenic line CACCCδ-LCR (lane 2) and wt whole blood mouse as a negative control for δ-globin gene expression (lane 3). M is the DNA molecular weight marker plasmid ΦX174 HaeIII-digested. (B) Relative expression levels of δ-globin gene by RT-qPCR. The histogram represents the expression level of δ-globin gene analyzed in blood samples from the transgenic line bearing the entire human β-globin cluster line 72 (black), the transgenic line bearing the δ-globin gene (CACCCδ-LCR) in homozygosity (dark gray) or heterozygosity (light gray). mRNA levels of reference genes were used for normalization in all cases. ***P<0.001 or **P<0.01 according to a t-test.
