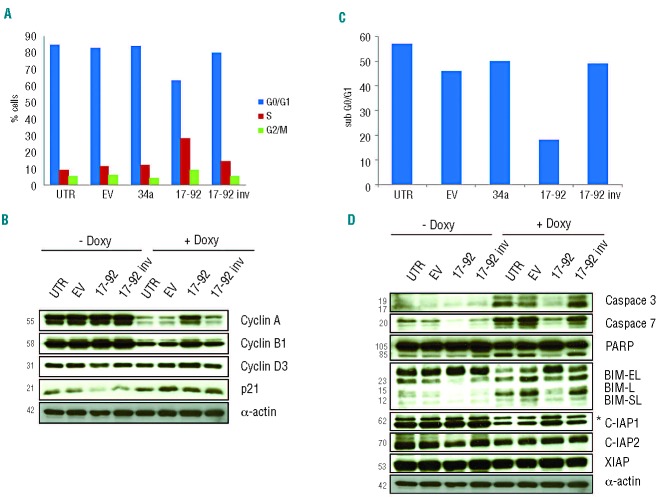
Figure 4.
(A) Cell cycle analysis of TS-SUP-M2 S3S cells expressing the indicated miRNA 5 days after doxycycline treatment. Cells expressing miR-17~92 cluster displayed reduced G0/G1 arrest and increased S-phase as compared to control cells and cells transduced with the indicated lentiviral particles. Cell cycle was analyzed by propidium iodide staining-flow cytometry. These findings are representative of three independent experiments. (B) Western blot analysis of the experiment described above revealed that cells expressing the miR-17~92 cluster showed increased levels of cyclin A, B1 and D3 following STAT3 KD as compared to control cells. (C) TS-SUP-M2 S3S cells expressing the miR-17~92 cluster undergo reduced apoptosis as compared to control cells. Propidium iodide staining analysis was performed at day 9 after induction with doxycycline. The sub-G0/G1 fraction was used to quantify apoptotic cells. These findings are representative of three independent experiments. (D) Western blot analysis of the experiment descibed above (C) revealed that miR-17~92 over-expressing cells displayed lower levels of activated caspase 3 and caspase 7, processed PARP, BIM and higher levels of IAP1 protein. Asterisk (*) indicates unspecific band for IAP1.

