
Figure 1.
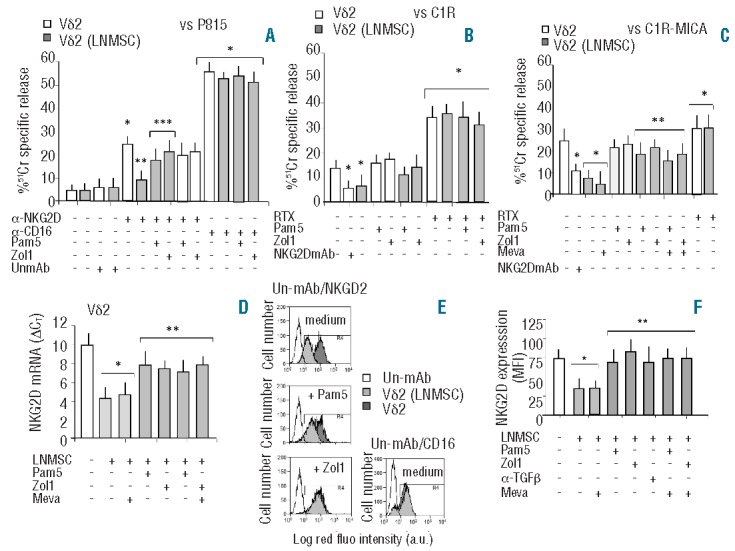
N-BPs prevent the inhibition of NKG2D-mediated lymphoid cell killing and NKG2D downregulation induced by LNMSC on Vδ2 T cells. Vδ2 T cells isolated from PBMC were cultured with IL2 alone (white columns) or with IL2 and either untreated LNMSC or LNMSC pre-treated for 12 h with Pam (5 μg/mL) or Zol (1 μg/mL) at the 1:10 LNMSC:Vδ2 T ratio (gray columns). Some samples were treated for 48 h with mevastatin (Meva, 10 μM) and Zol added during the last 12 h. In some experiments, Vδ2 T cells were pre-treated with Pam or Zol in order to exclude any possible direct effect of NBPs on these cells. On Day 5, Vδ2 T cells were harvested and used in a redirected killing assay against the P815 cell line in the presence of the anti-NKG2D or the anti-CD16 mAb or an unrelated mAb (UnmAb) matched for the isotype (all at 5 μg/mL) (A), or in an ADCC assay against the C1R (B), or the C1R-MICA+ lymphoid cell lines (C), in the presence of the anti-CD20 therapeutic antibody rituximab (20 μg/mL, RTX). In some experiments, Vδ2 T cells were exposed to saturating amounts (5 μg/mL) of anti-NKG2D mAb before adding the C1R or the C1R-MICA+ targets The effector-target (E:T) ratio was 10:1. Target cells were labeled with 51Cr and used in a standard 4-h cytolytic assay. Results are shown as percentage of 51Cr specific release and are the mean±SD from 6 experiments. (A) *P<0.005 versus Vδ2 T cells without mAb or with UnmAb; **P<0.001 versus NKG2D-triggered Vδ2 T cells not co-cultured with LNMSC; ***P<0.001 versus Vδ2 T cells co-cultured with untreated LNMSC. (B and C) *P<0.001 versus Vδ2 T cells not co-cultured with LNMSC or in the absence of mAbs; **P<0.001 versus Vδ2 T cells after co-culture with LNMSC. (D) Transcription of NKG2D in Vδ2 T cells before (white column) or after (gray columns) co-culture with LNMSC either untreated or treated with Pam (5 μg/mL) or Zol (1 μg/mL) or Meva (10 μM), as indicated. Q-RT-PCR was performed with the fluorescent Taqman method. mRNAs were normalized to RPLP0 as a control gene and referred to a standard curve. After subtracting the threshold cycle (CT) value for RPLP0 from the CT values of the target genes, results were expressed as ΔCT. *P<0.001 versus Vδ2 T cells not co-cultured with LNMSC (white columns); **P<0.001 versus Vδ2 T cells co-cultured with LNMSC, with or without Meva (light gray columns). (E) FACS analysis of expression of NKG2D or CD16 by immunofluorescence using the specific mAbs followed by isotype specific PE-GAM before (dark gray) or after (gray) co-culture with LNMSC either untreated (medium) or treated with Pam (5 μg/mL) or Zol (1 μg/mL). Empty histograms show Vδ2 cells stained with an unrelated mAb (un-mAb) followed by PE-GAM (histograms of Vδ2 T cells from LNMSC co-cultures stained with un-mAb were exactly superimposable; data not shown). Results are expressed as log red fluorescence intensity (a.u.) versus number of cells and are from one representative experiment out of 6. (F) Vδ2 T cells harvested from the indicated culture conditions were analyzed for NKG2D expression. In some experiments cultures were performed with an anti-TGFβ mAb (5 μg/mL) as indicated. Results are shown as mean fluorescence intensity (MFI) of NKG2D expression and are the mean±SD from 6 experiments *P<0.005 versus Vδ2 T cells not co-cultured with LNMSC (white column); **P<0.001 versus Vδ2 T cells after co-culture with LNMSC. Statistical analysis: two-tailed Student’s t-test.