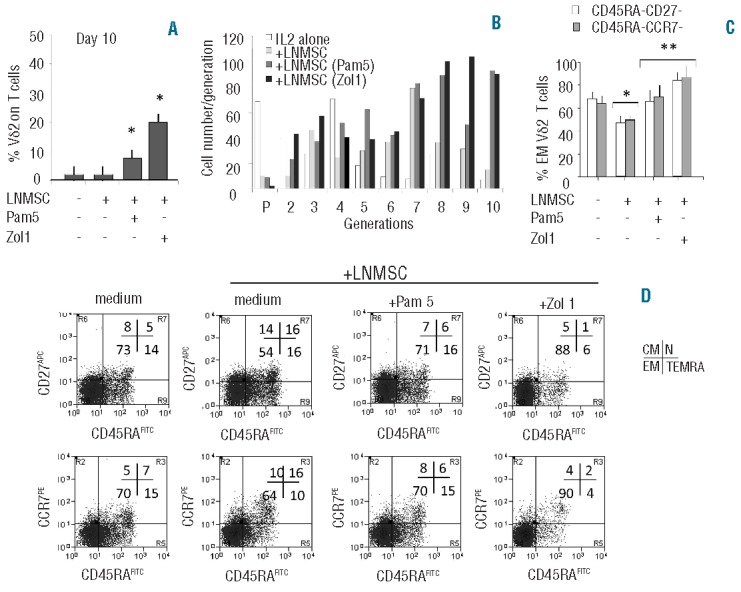
Figure 3.

N-BPs-treated LNMSC drive Vδ2 T lymphocyte to effector memory T cells. (A and B) Peripheral blood T lymphocytes (A) or CFSE-labeled purified Vδ2 T cells (B) were co-cultured with LNMSC, either untreated or pre-treated for 12 h with Pam (5 μM) or Zol (1 μM), as indicated. On Day 10, percentage of Vδ2 T cells was evaluated by immunofluorescence using the anti-Vδ2 mAb PE-BB3 and FACS analysis (A). Mean±SD from 4 experiments. *P<0.001 versus T or Vδ2 cells cultured on untreated LNMSC. (B) Proliferation was assessed on the basis of the decreased green (CFSEdull) fluorescence of dividing cells. Data were analyzed by the Modfit 3.1 computer program and expressed as cell number/generation of proliferating cells. (C and D) Immunophenotype of Vδ2 T cells cultured alone or co-cultured for 10 days with untreated or Pam or Zol pre-treated LNMSC, as indicated, stained with APC-anti-CD27 or PE-anti-CCR7 and FITC-anti-CD45RA. (C) Results are expressed as percentage of effector memory (EM) T cells, i.e. CD45RA-CD27- (white columns) or CD45RA-CCR7- cells (gray columns). Mean±SD from 6 experiments *P<0.001 versus Vδ2 T cells in the absence of LNMSC **P<0.001 versus Vδ2 T cells co-cultured with untreated LNMSC. (D) Vδ2 T cells alone (medium, left dot plots) or Vδ2 T cells co-cultured with untreated or treated LNMSC, as indicated, were stained as in (C). Results are expressed as log green fluorescence intensity (x-axis, MFI, a.u.) versus either log far red (first row) or red (second row) fluorescence intensity (y-axis, MFI, a.u.). One representative experiment out of 6 is shown. Percentages of positive cells in each quadrant show the naive (N, upper right, double positive), central memory (CM, upper left, CD45RA− and CD27+ or CCR7+), effector memory (EM, lower left, double negative) and terminally differentiated effector memory (TEMRA, lower right, CD45RA+ but CD27− or CCR7−) cells. Statistical analysis: two-tailed Student’s t-test.
