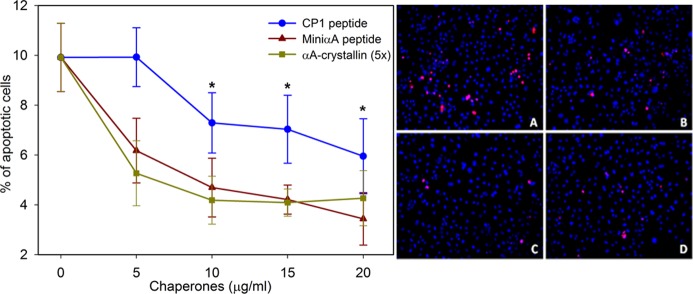
Figure 8.

Suppression of oxidant-induced cell death by αA-mini-chaperone or CP1-chaperone. For the data displayed in the left panel, COS-7 cells were treated with 150 μM H2O2 and 0–20 μg of either mini-αA or chimeric mini-αA for 3 h. Apoptosis was assessed by TUNEL staining, and the percentage of dead cells was quantified by counting grids. Asterisks indicate P < 0.01 for mini-αA or CP1 at 10–20 μg compared to control. The right panel shows TUNEL staining of the samples: (A) control, (B) CP1 (20 μg/mL), (C) αA-mini-chaperone (20 μg/mL), and (D) wild-type αA (100 μg/mL).
