
Figure 7.
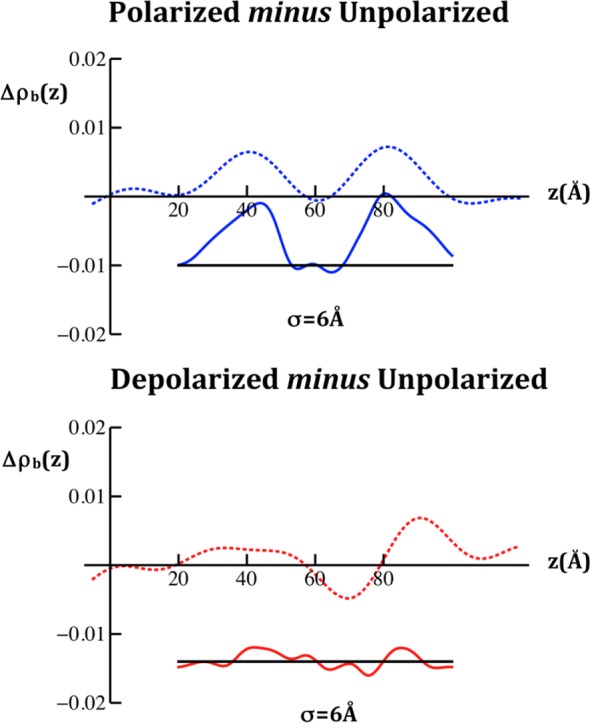
Comparison of the difference nSLD profiles determined from the neutron interferometry experiments for VSD:POPC membrane tethered to the surface of an inorganic multilayer substrate (dotted) with those calculated from molecular dynamics simulations for an untethered VSD:POPC membrane (solid) for the two pairs of potentials indicated, each membrane fully hydrated. As with the comparison of the difference xSLD profiles shown in Figure 6, we show here only the case where the abscissa scale for the difference profiles calculated from the simulation have been expanded by 25%. The time-averaged profiles calculated from the simulations have been smoothed via convolution with a Gaussian whose 1/e width was 2σ, the larger value used here to allow for the lower spatial resolution of the nSLD profiles. We note that the nSLD profiles shown here are in units of 10–4/Å2.