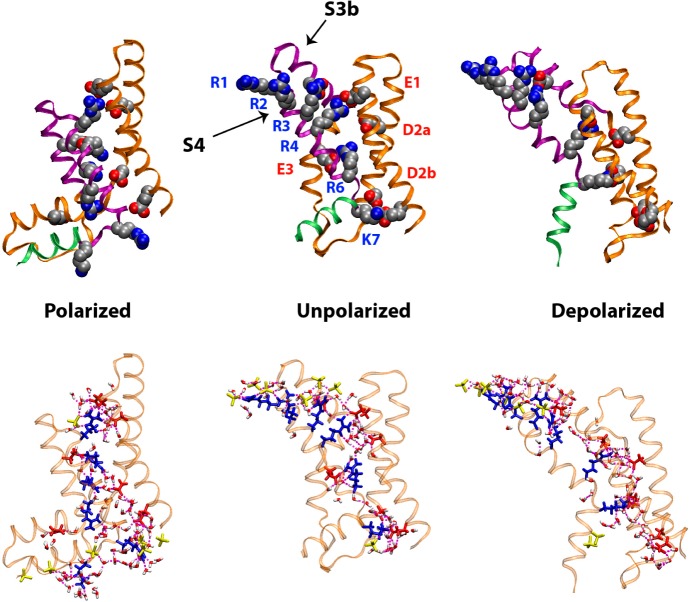
Figure 8.
VSD configurations from microsecond time scale atomistic MD simulations. Top row: the VSD backbone is shown in ribbon representation with the S1–S3a segments colored orange, the S3b–S4 helix-turn-helix in purple, and the S4–S5 linker in green. Conserved charged side chains (shown as filled spheres) are colored by atom type (carbon, silver; oxygen, red; nitrogen, blue). Upon a change in applied membrane potential, the motion of the highly conserved basic side chains on (R1 through K7) on the S4 helix induces conformational changes in the S3b–S4 helical hairpin. As the basic side chains move within the membrane electric field, they exchange salt-bridge interactions with acidic side chains in conserved positions (E1, D2a, D2b, and E3) as well as two additional acidic side chains in S3b and S1 (unlabeled). Bottom row: the solvation of the VSD by the membrane environment is represented as a H bond network between the VSD basic and acidic side chains (blue and red, respectively), lipid phosphate groups (yellow), and waters (colored by atom type).

