
Figure 1.
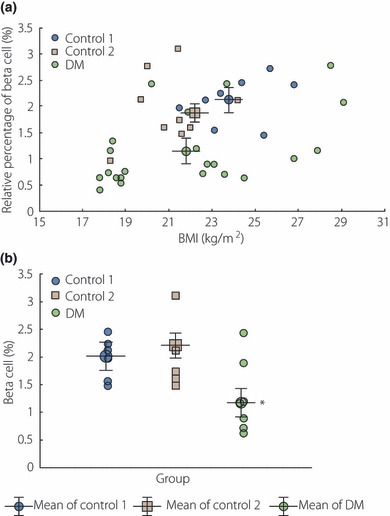
(a) The body mass index (BMI) and β‐cell mass were linearly correlated in control group 1 (r2 = 0.64, P = 0.003) and diabetic patients (r2 = 0.55, P < 0.05). Remarkably, the mean value of the relative volume of β‐cells in diabetic patients was lower than those of other control groups (adapted fromYoon et al.). (b) The pattern of distribution of β‐cells (%) among groups whose BMI ranges were between 21 and 25 kg/m2. The mean value of the relative volume of β‐cells in diabetic patients was lower than those of other control groups (adapted from Yoon et al., Copyright 2003, The Endocrine Society).