
Figure 1.
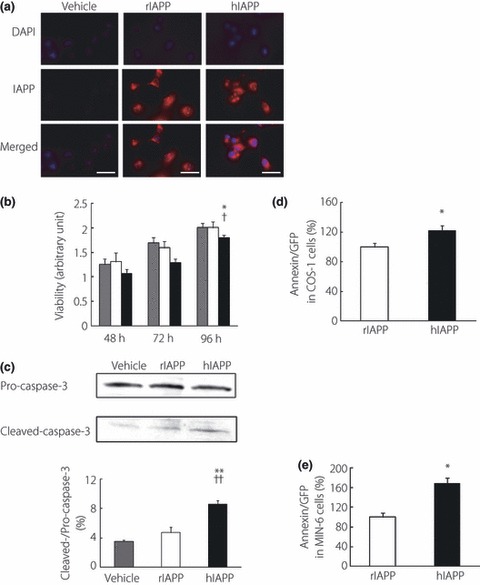
(a) Immunostaining of COS‐1 cells 48 h after transfection with pMT2 vector (vehicle), pMT2‐rat islet amyloid polypeptide (rIAPP) and pMT2‐human islet amyloid polypeptide (hIAPP) by anti‐IAPP antibodies. Nuclei were labeled with DAPI. Bar, 50 μm. (b) Modified 3‐(4, 5‐dimethylthiazolyl‐2)‐2, 5‐diphenyltetrazolium bromide (MTT) assays of COS‐1 cells transfected with vehicle (gray bars), rIAPP (white bars) and hIAPP (black bars). Composite histogram profiles represent the ratios of absorbance units of live cells to those 24 h after transfection with designated plasmids (n = 17). *P < 0.05 vs vehicle, †P < 0.05 vs rIAPP. (c) Representative western blot of pro‐ and cleaved‐caspase‐3 of cell lysates 48 h after transfection of each plasmid. The intensity ratios of cleaved‐ to pro‐caspase‐3 are shown. All values represent the mean ± SEM (n = 3). **P < 0.01 vs vehicle, ††P < 0.01 vs rIAPP. (d,e) Annexin positive cells per green fluorescent protein (GFP) positive cell 96 h after transfection of hIAPP‐ or rIAPP‐GFP plasmid in (d) COS‐1 or (e) MIN‐6 cells as analyzed by flow cytometry. All values represent the mean ± SEM (n = 4, respectively). *P < 0.05 vs rIAPP.