
Figure 2.
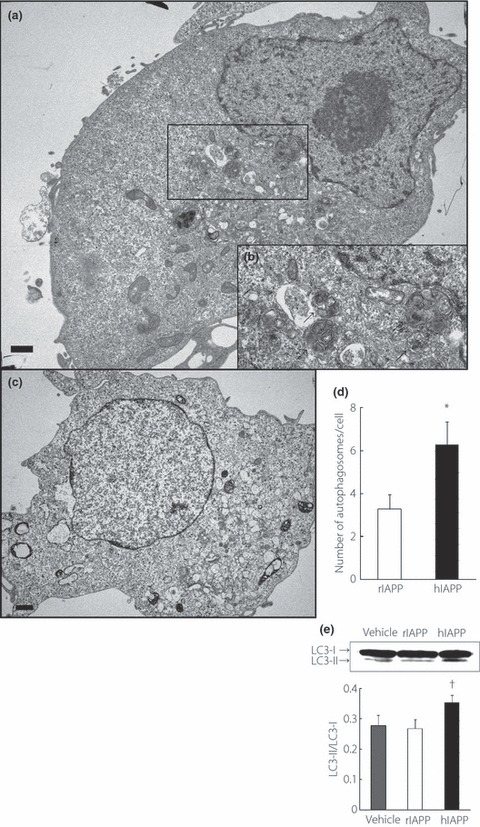
Electron micrographs of COS‐1 cells 48 h after transfection of (a,b) hIAPP or (c) rIAPP plasmid. Panel (b) is high magnification images of panel (a). Bar, 1.0 μm. (b) Typical autophagosomes are shown (arrows). (d) Number of autophagosomes per cell in rIAPP‐ or hIAPP‐transfected COS‐1 cells. All values represent the mean ± SEM (n = 15, respectively). *P < 0.05 vs rat islet amyloid polypeptide (rIAPP). (e) Western blot analysis of light chain 3B (LC3). The intensity ratios of LC3‐II to LC3‐I are shown. All values represent the mean ± SEM (n = 7). †P < 0.05 vs rIAPP.