
Figure 3.
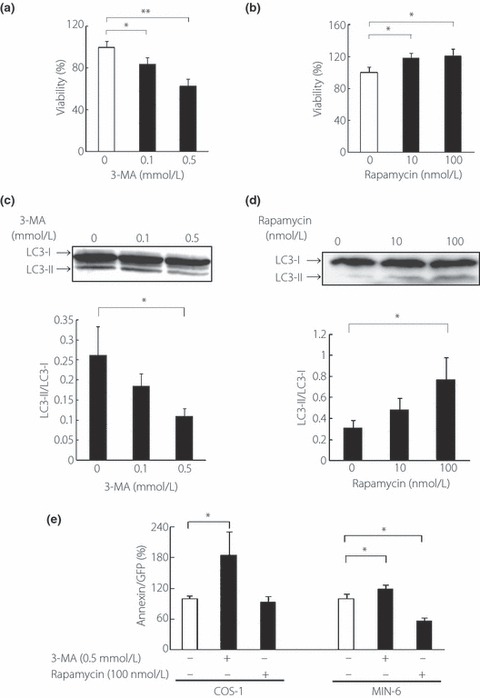
(a,c) Cell viability expressing human islet amyloid polypeptide (hIAPP) after treatment with 3‐MA or rapamycin in COS‐1 cells (percentage of untreated cells). All values represent the mean ± SEM (n = 7, respectively). (b,d) Western blot analysis of light chain 3B (LC3) in hIAPP expressing COS‐1 cells. The intensity ratios of LC3‐II to LC3‐I are shown. All values represent the mean ± SEM (n = 4, respectively). (e) Annexin positive cells per green fluorescent protein positive cells after the treatment with 3‐MA or rapamycin in COS‐1 or MIN‐6 cells as analyzed by flow cytometry (percent of untreated conditions). All values represent the mean ± SEM (n = 4, respectively). *P < 0.05, **P < 0.01 for the differences between the indicated groups.