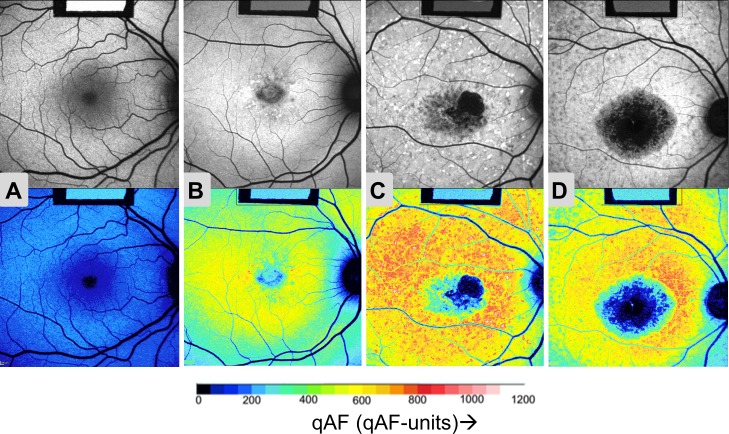
Figure 2.
Quantified fundus autofluorescence images. Autofluorescence images (upper panels) with corresponding color-coded qAF images (lower panels) for the right eye of (A) a control (20 years) and for STGD1 patients: (B) #28 (20 years); (C) #2 (25 years); and (D) #33 (19 years). Images (B), (C), and (D) are examples of Fishman Stages I, II, and III, respectively. As shown in the qAF color-code scale (below), lower qAF levels are indicated as blue and higher qAF levels as red colors (see scale). Note that the images for all eyes had similar GLs after adjusting the sensitivity to optimize the dynamic range. Thus, the GL of the internal reference (rectangle in upper center of each image) is lower in the three STGD patients ([B–D], upper) than in the healthy eye ([A], upper), reflecting the higher AF levels of the patients. In the color-coded qAF images ([A–D], lower) the reference has the same color.

