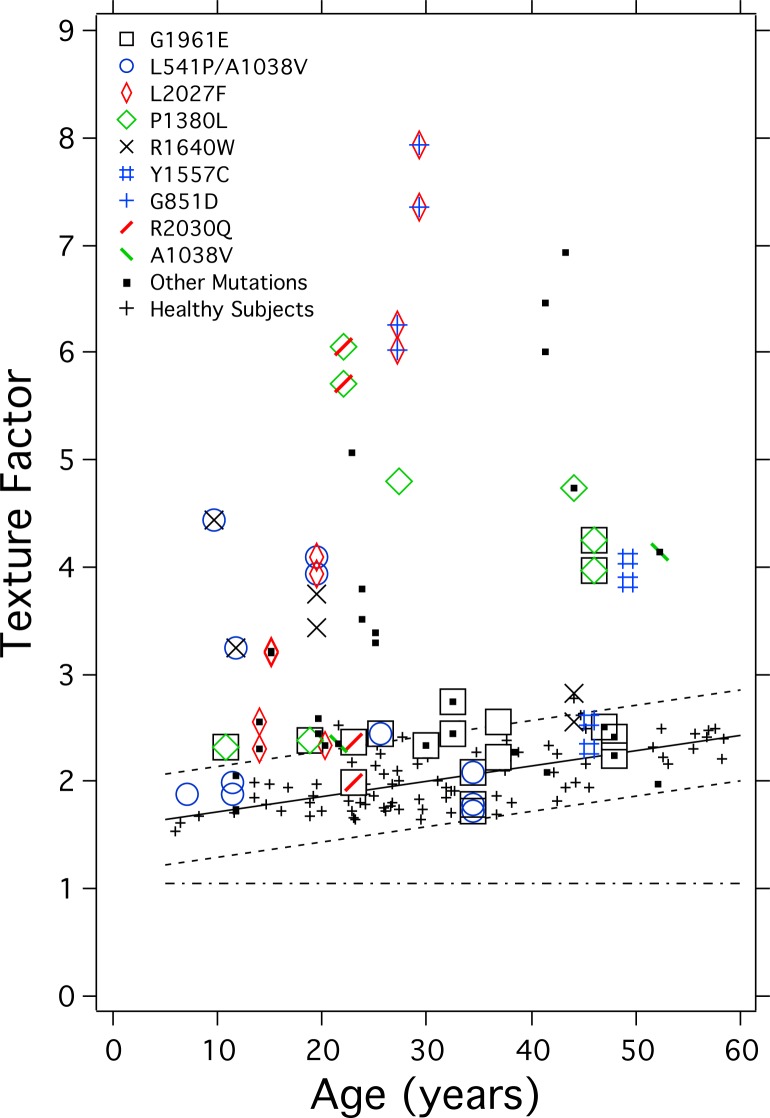
Figure 6.
Texture factor in one or two eyes of each STGD1 patient (see legend) and healthy subjects (black crosses) as a function of age. Mean (solid black line) and 95% confidence intervals (interrupted line) for the healthy subjects are based on TF data from 83 white subjects (small +). The linear fit was TF = 1.58 + 0.014. Age (r2 = 0.42, P = 0.001). The horizontal (interrupted) line is the mean TF (1.1; 95% confidence interval: 0.8–1.4) associated with uniform fluorescent targets (see Supplementary Material: “Texture Factor”).

