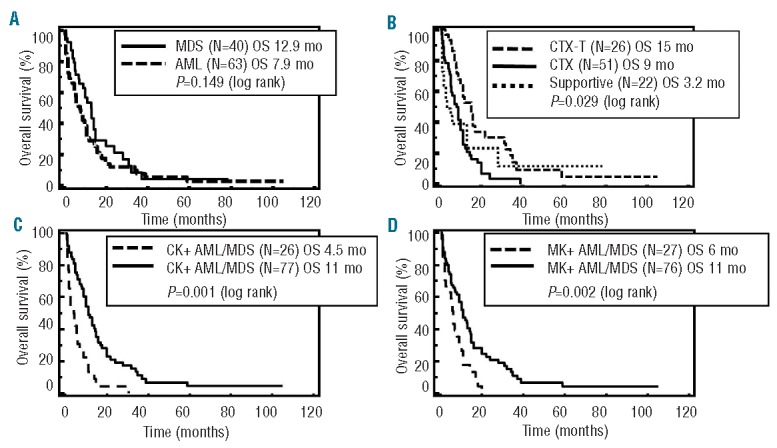
Figure 2.

Survival curves using Kaplan-Meier analysis in 103 patients with inv(3)/t(3;3) MDS and AML. (A) OS in inv(3)/t(3;3) MDS vs. inv(3)/t(3;3) AML. (B) OS in chemotherapy with allogeneic stem cell transplant vs. chemotherapy alone vs. supportive therapy (P=0.029 log rank). (C) OS in complex vs. non-complex karyotype (P<0.001 logrank). (D) OS in monosomal vs. non-monosomal karyotype (P=0.002 log rank) inv(3)/t(3;3): inv(3)(q21q26.2)/t(3;3)(q21;q26.2). MDS: myelodysplastic syndrome; AML: acute myeloid leukemia; OS: overall survival; CTX-T: chemotherapy with stem cell transplant; CTX: chemotherapy; CK: complex karyotype; MK: monosomal karyotype.
