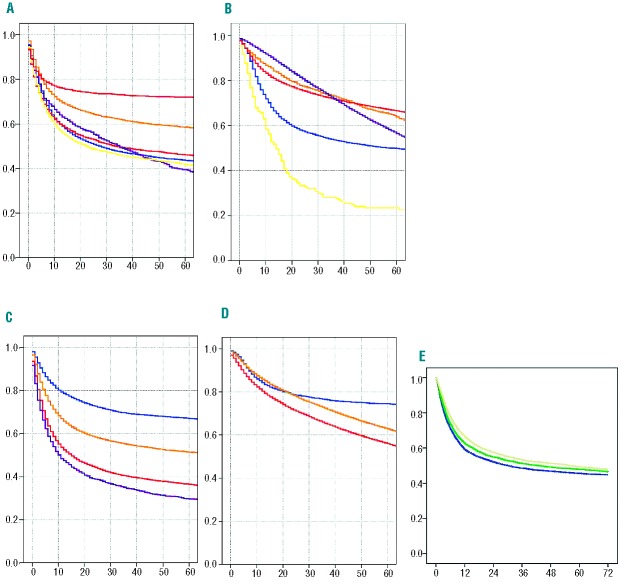
Figure 1.
The figure depicts the diversity of the population of patients and the heterogeneity in outcome as illustrated by the Kaplan-Meier estimates of overall survival for 107,904 patients who underwent allogeneic (n=41,623) or autologous (n=66,281) HSCT in Europe between 1999 and 2006. (A) Allogeneic HSCT and (B) autologous HSCT showing overall survival by main disease category (acute leukemia, blue; chronic leukemia, orange; lymphoma, red; plasma cell disorders, purple; myelodysplastic disorders/myeloproliferative neoplasms, yellow; and bone marrow failure syndromes, allogeneic only, pink). No P values are given. The figure simply illustrates the heterogeneity; the study was not meant to assess differences between main disease categories. (C) Allogeneic HSCT and (D) autologous HSCT showing overall survival depending on EBMT risk score. Allogeneic HSCT: score 0+I (n=7,217; blue), score II+III (n=18,524; yellow), score IV+V (n=13,781; red), and score VI+VII (n=2,101; lilac). Autologous HSCT: score 0+I (n=3,889; blue), score II+III (n=36,290; yellow), and score IV+V (n=39,883; red). The hazard ratios for increasing risk with increasing score are depicted in Table 2. (E) Overall survival (OS) of 15,618 patients with an allogeneic HSCT in 1999 (4,742 patients; OS at 3 years 47.3%; blue), in 2002 (5,043 patients; OS at 3 years 50.5%; green) and in 2005 (5,833 patients; OS at 3 years 53.8%; yellow), illustrating the improvement over calendar time.

