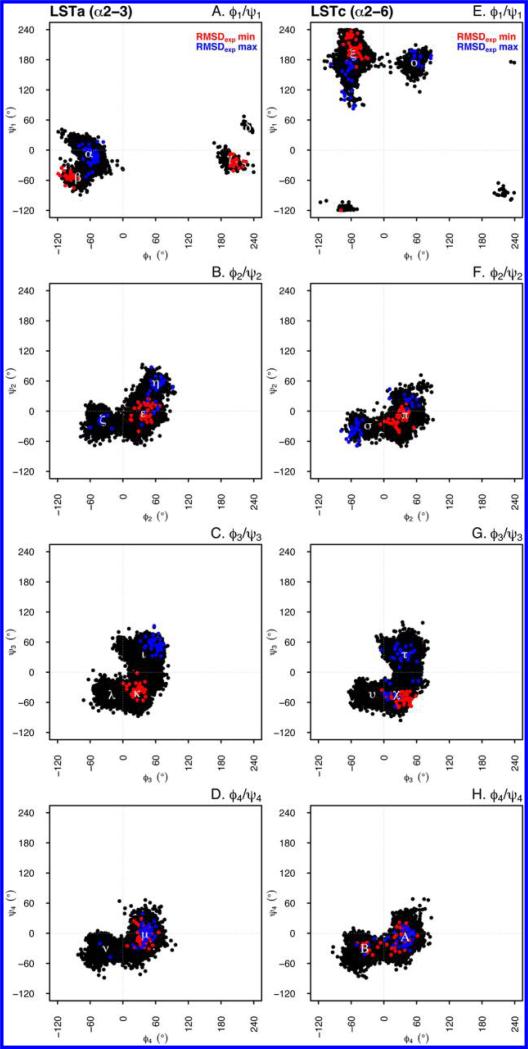
Figure 3.
Torsional states visited during the 100 ns simulation time for LSTa (left) and LSTc (right). For each glycan, the dihedral angle pairs [ϕ1 and ψ1 (A and E), ϕ2 and ψ2 (B and F), ϕ3 and ψ3 (C and G), and ϕ4 and ψ4 (D and H)] are shown. The red dots represent conformers that better fit the experimental NMR NOESY data (rmsdexp min set of conformations), while blue dots correspond to the conformers that exhibit poor agreement with the experimental constraints (rmsdexp max). The positions and populations of the torsional states are listed in Table 2.

