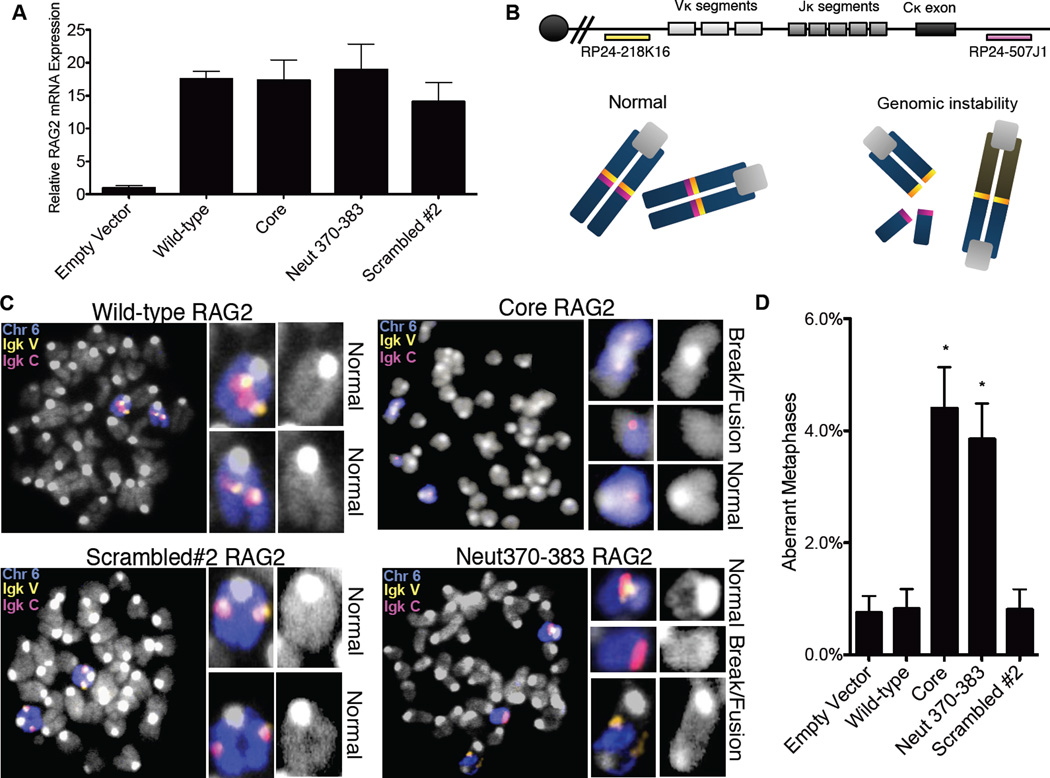
Figure 3. The acidic region in RAG2 promotes genomic stability.
RAG2 mRNA expression in complemented RAG2−/− pre-B cells(A). (B) Top; Igκ locus with BAC probes for DNA FISH. Bottom; Schematic of normal and aberrant metaphases. (C) Metaphases from complemented RAG2−/− preB cells with the BAC probes indicated in A. and a FITCchr6 paint; (D) Percentages of aberrant metaphases identified at the Igκ locus. Results from three separate experiments (Figure S3) were collected and combined. Statistical analysis was conducted using a one-tailed Fisher’s exact test for comparison to the wild-type complemented aberrant metaphases. Error bars reflect the standard error of the mean.

