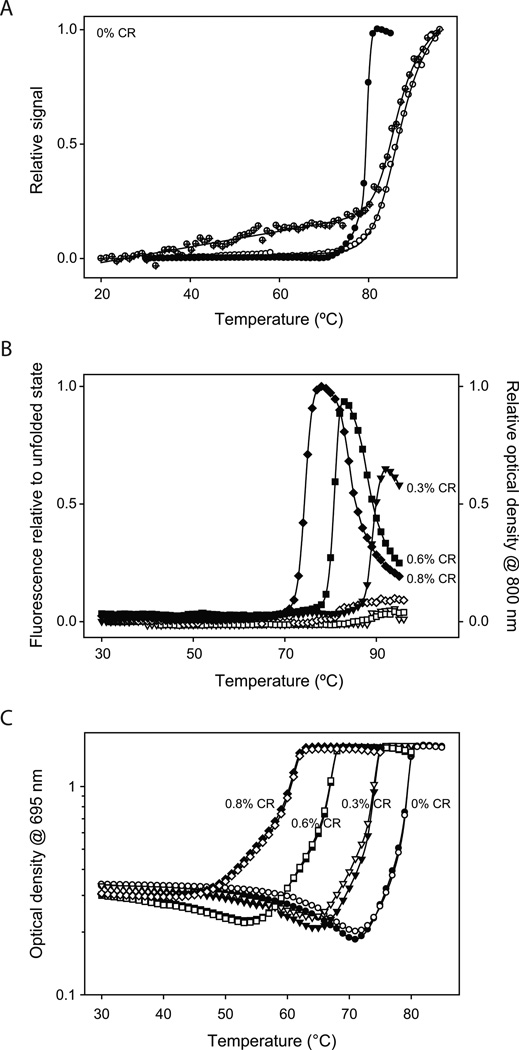
Fig. 4.
(A) Comparison of the protein aggregation curve measured in the absence of CR (solid circles, data from Fig. 3) and the global protein unfolding measured by both Trp fluorescence (hollow circles) and CD at 222 nm (crossed circles). (B) Changes in fluorescence intensity and optical density at 800 nm measured simultaneously while the protein (25 µM) was aggregating at various CR concentrations. Solid and hollow symbols represent the changes in optical density and fluorescence respectively. (C) Changes in the 695 nm optical density during thermal scanning at 300 µM protein concentration. Solid and hollow symbols represent duplicate runs.

