
Figure 4.
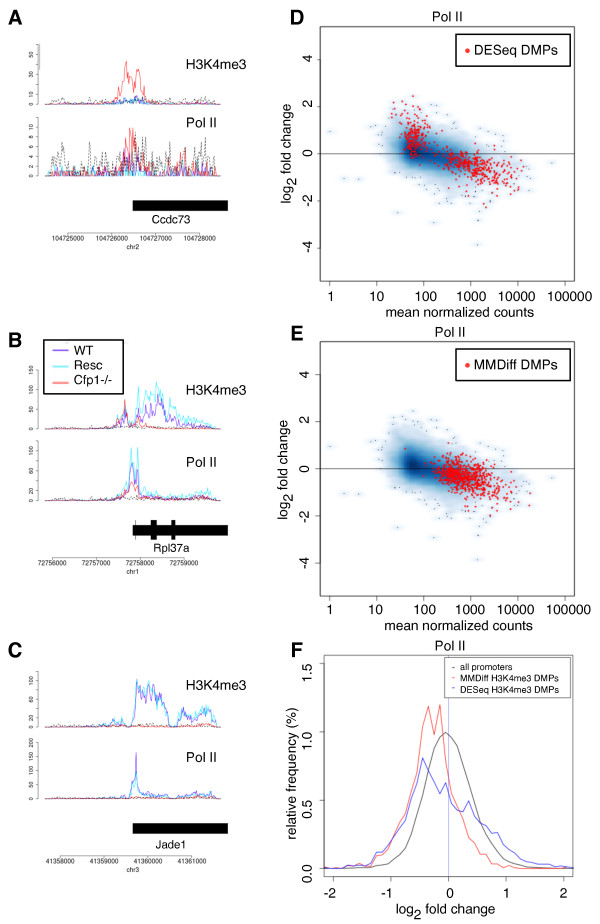
Changes of H3K4me3 levels are correlated with changes in Pol II binding. A-C Example DMPs at three annotated genes, showing H3K4me3 patterns and Pol II binding profiles. Input is shown as dashed, black lines. A Promoter called by DESeq but not MMDiff showing an increased H3K4me3 peak in the Cfp1-/- sample. B Promoter called by MMDiff but not DESeq with substantial decrease in H3K4me3 and modest change in Pol II binding. C Promoter of Jade-1 showing complete loss of H3K4me3 accompanied with elimination of Pol II binding (called by both). D, E MA-plots of Pol II binding. Promoters with significant differential H3K4me3 patterns are marked with red dots: D DMPs according to DESeq and E DMPs according to MMDiff. F Distribution of observed fold changes in Pol II binding (Cfp1-/- versus WT/Resc). black: all promoters, red: DMPs detected by MMDiff (Wilcoxon rank sum test, p-value < 10-15). blue: DMPs detected by DESeq: p-value < 10-13.