
Figure 7.
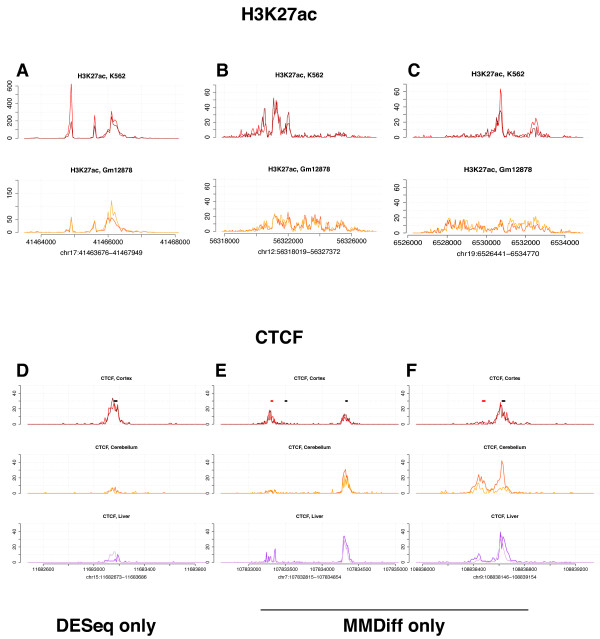
Differential peak calling in H3K27ac and CTCF data sets. A-C: Three example H3K27ac peaks called as differential when comparing human K562 and GM12878 cell lines (data from ENCODE consortium). D-F Three example CTCF peaks in samples derived from mouse cortex, cerebellum and liver. Peaks are called differential in the cortex vs cerebellum comparison. Black and red bars demark CTCF motifs on the forward and reverse strand, respectively. Peaks shown in A, D) are called by DESeq only; peaks in B, C, E, F are called by MMDiff only.