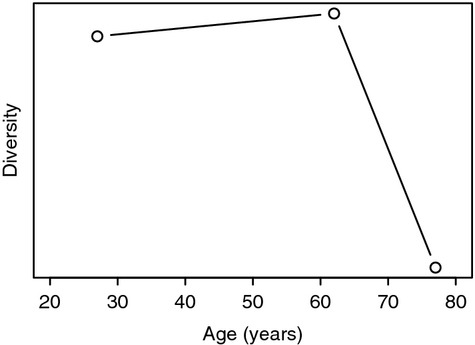
Figure 2.

T-cell receptor diversity and age. Summary of naive CD4 diversity at different ages using data from Naylor et al.31 that analysed a cross-sectional sample of young (25–30 years), middle aged (60–65 years), and elderly (75–80 years) people. Values on y-axis are calculated using Simpson's formula50 applied to frequency spectrum data.31
