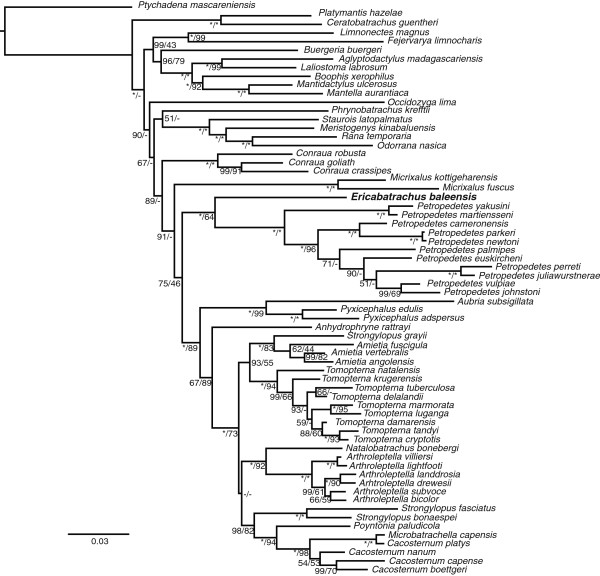
Figure 3.
Small-scale Bayesian tree under GTR model showing the phylogenetic placement of Ericabatrachus baleensis (in bold). Support values for the nodes correspond to posterior probabilities (left) and non-parametric bootstraps (right). Values with “*” represent maximal support (100%), values lower than 40% are denoted by “-”.

