
Figure 3.
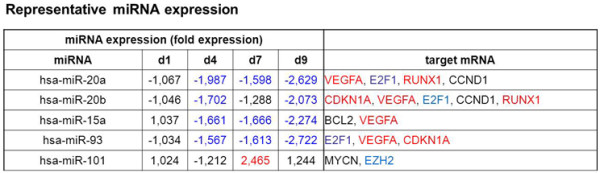
microRNA expression level. The expression levels of 806 miRNAs were determined at day 1, 4, 7 and 9 by LNA microarray. Displayed are five selected miRNAs with the corresponding mRNA targets, identified by DIANA LAB (http://diana.cslab.ece.ntua.gr/tarbase/) and miRecords (http://mirecords.biolead.org/). In red are miRNAs and target mRNAs that are upregulated, downregulated genes are colored in blue and not regulated genes are in black.