
Figure 7.
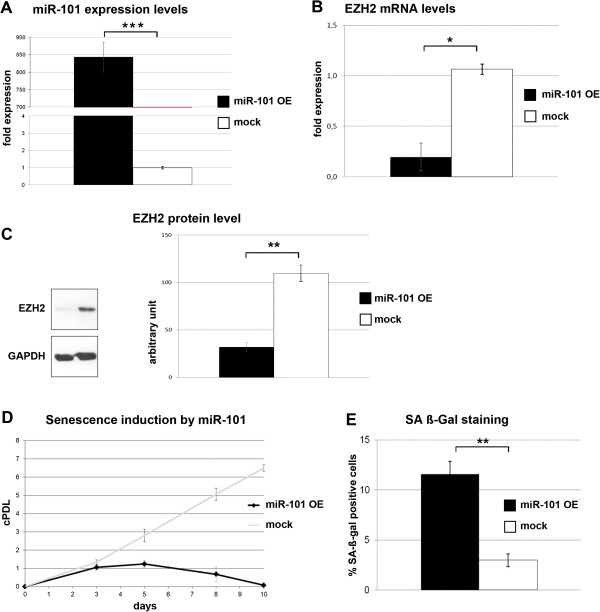
miR-101 overexpression induces premature senescence in HDFs. Cells were reverse transfected as described with miR-101 precursors for overexpression, negative control or with the transfection reagent (siPORT™ NeoFX™) at day 0, 3, 5 and 7. At day 9 RNA and protein were isolated. Expression levels of (A) miR-101 and (B) Ezh2 mRNA were determined by real-time qPCR. Data represents the mean ± SE for three independent experiments. (C) Standard Western blot analysis was performed with monoclonal mouse anti-Ezh2 antibody. Left panel represents densitometric data calculated out of three independent experiments (± SD). (D) Growth curve analysis of miR-101 overexpressing HDFs. cPDLs were calculated. Data represents the mean ± SD for three independent experiments. (E) To determine the senescence status of miR-101 overexpressing and control HDFs, cells were stained for SA-β-gal at day 9. Bars represent the relative amount of SA-β-gal positive cells (± SD). OE: overexpression; cPDL: cumulative population doublings. *p < 0.01; **p < 0.001.