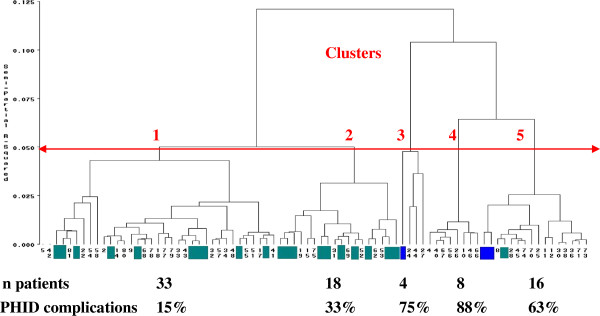
Figure 2.

Classification of 79 PHID patients by hierarchical cluster analysis, according to 23 immunological markers. ALTADIH Cohort, 2007-2010. The arrow defines the number of clusters. Patients with IgG subclass immunodeficiency are depicted in green. Patients with Good’s syndrome are depicted in blue. Other patients are CVID patients. The percentage of PHID complications by cluster is indicated.
