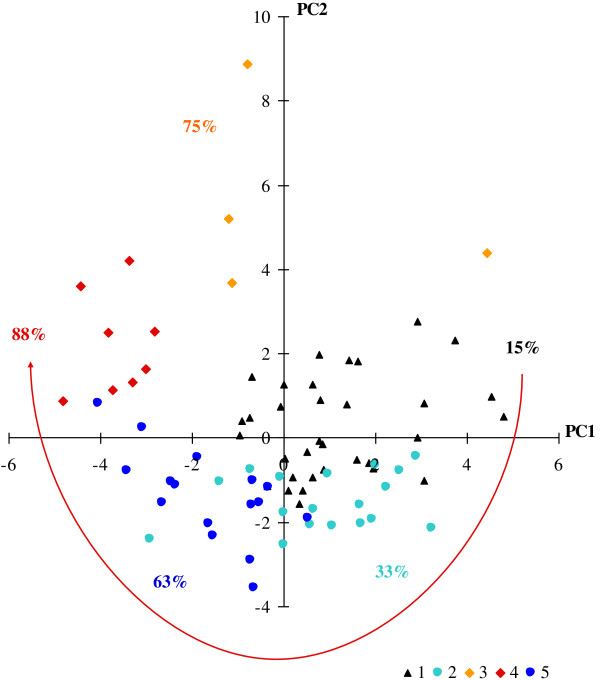
Figure 3.
Immunological interpretation of 5 clusters of CVID plotted on the first two principal components. ALTADIH Cohort, 2007-2010. The percentage of CVID complications, noted next to the clusters, increased in a clockwise manner as phenotypes approach the projection of activated HLA-DR + markers plotted in Figure 1 (red arrow).

