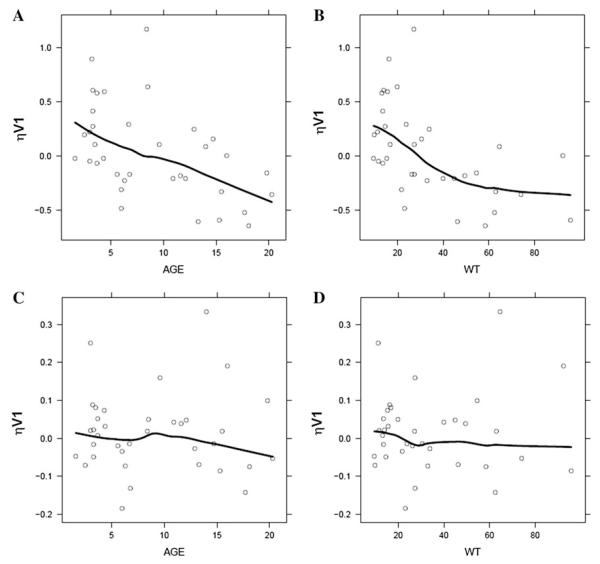
Fig. 2.
Exploratory graphics from the historical 3-compartment model and base model from current analysis for covariate relationships. a, b Relationship between inter-individual variability of central volume of distribution (ηV1) and age or body weight (WT) in the historical model including weight as a significant covariate. c, d Relationship between inter-individual variability of central volume of distribution (ηV1) and age or body weight (WT) in the base model including both weight and age as significant covariates. Solid line is a loess smooth fit

