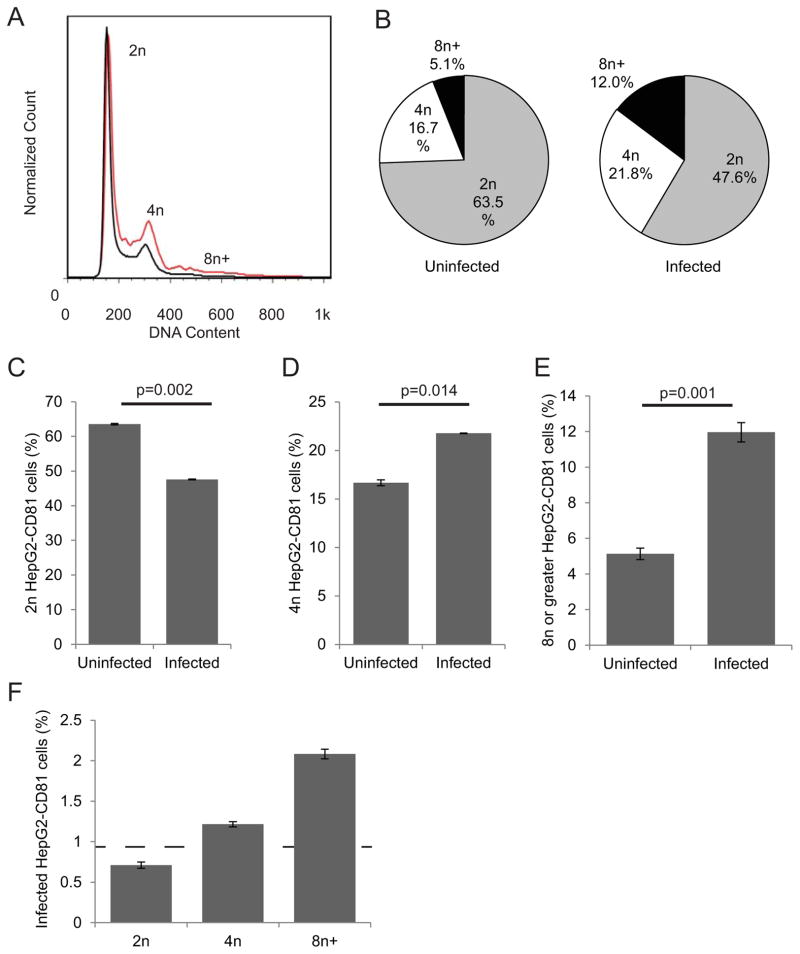
Figure 1. Higher ploidy is more prevalent in parasite-infected hepatoma cells in vitro.
HepG2-CD81 cells were infected with P. yoelii sporozoites, harvested at 2 hpi and stained for infection and ploidy. Overlays of histograms of DNA stain for infected (red line) and uninfected (black) show lower peaks for infected 2n cells, and higher peaks for infected 4n and greater cells (A). The relative percentage of cells in each ploidy state greatly differs between uninfected and infected cells (B). A quantitative analysis of the percent of cells in each ploidy state shows significant decrease in cells with 2n chromosomes in infected cell population (C), and a significant increase in cells with 4n (D) or greater (E). Similarly, the rate of infection is lower in 2n cells, and higher in 4n and greater cells (F). Dashed line indicates the overall infection rate. Error bars show S.E.M., biological replicates of n=3.

