
Figure 2.
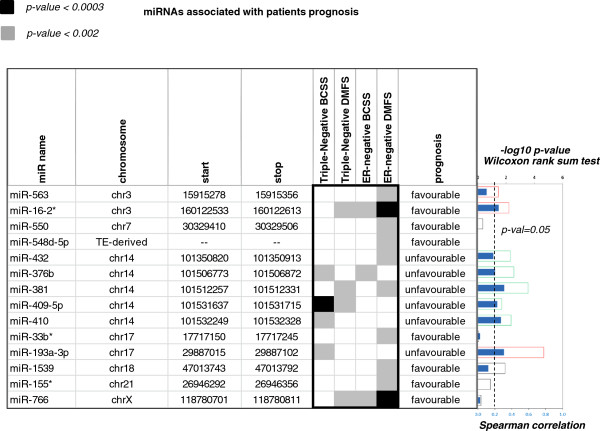
Prognostic miRNAs in ER-negative and triple-negative tumour sub-cohorts (log-rank p-value < 0.002 and FDR q-value < 0.2). Chromosomal positions are indicated, except from miR-548d-5p, which co-locates with a DNA transposable element (TE). Left Panel: Results from independent Cox-regression analyses run on triple-negative and ER-negative tumours Right Panel: Association between miRNA expression and DNA gains/losses. Filled blue bars represent Spearman correlation values. Shaded bars represent the -log10 q-value of the Wilcoxon test, resulting from the comparisons of tumours with DNA gains (red bars) and losses (green bars) to tumours without DNA changes.