
Figure 4.
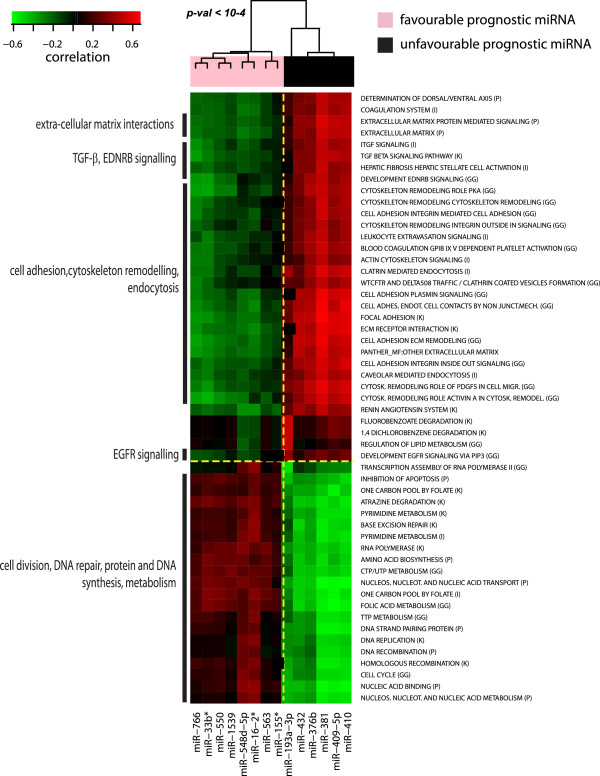
Pathways associated to the expression of prognostic miRNAs. 2D Hierarchical Clustering heat map using Spearman correlations between prognostic miRNAs in TNBC and ER-negative breast tumours (heat map columns) and gene set scores representing pathways activation (heat map rows). Gene set sources are indicated in brackets: GG (GeneGo), I (Ingenuity), K (KEGG), P (Panther). The p-value on the dendogram indicates the statistical significance of the clusters, evaluated using bootstrapping analysis (n = 10.000).