
Figure 5.
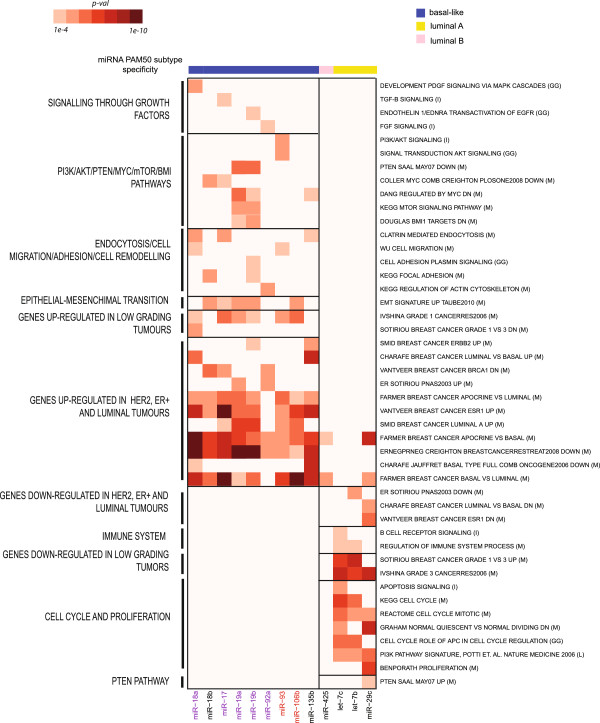
Pathways and signatures potentially influenced by the action of miRNAapt. For each miRNAapt (columns), the heatmap represents gene set enrichments (expressed as the -log10 of the Fisher-test p-value), in the list of individual anti-correlated miRNAapt target genes. miR-106b-25 and miR-17-92 cluster members are respectively highlighted in red and purple. Gene set sources are indicated in brackets: GG (GeneGo), I (Ingenuity), K (KEGG), P (Panther), L (Literature).