
Figure 1.
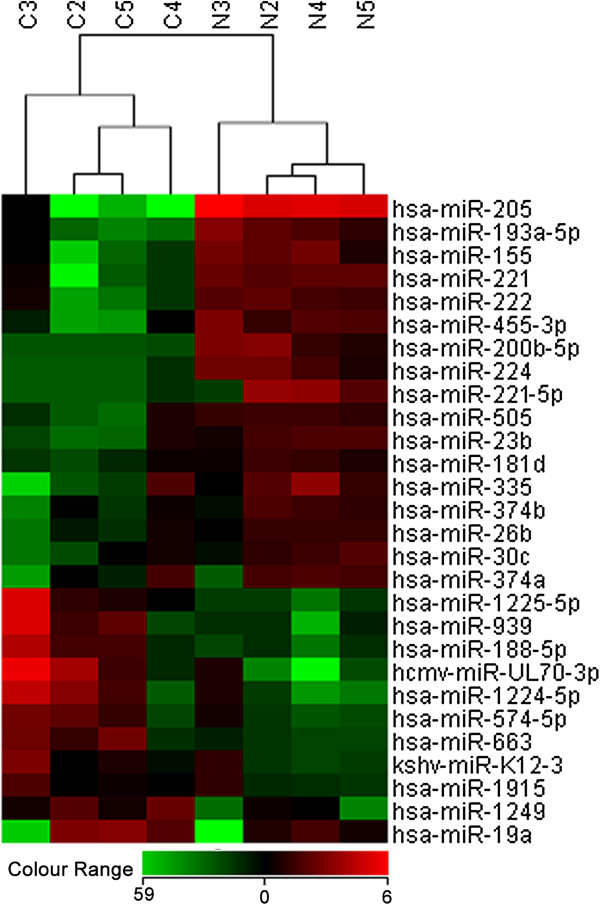
Heat map diagram and hierarchical clustering of differentially expression miRNAs between matched tumor and adjacent benign tissue. Each row represents a miRNA, and each column a sample either tumor tissue (C2, C3, C4, C5 and C6) or benign tissue (N2, N3, N4 and N5). The color scale shown at the bottom illustrates the relative expression level of a miRNA across all samples.