
Figure 3.
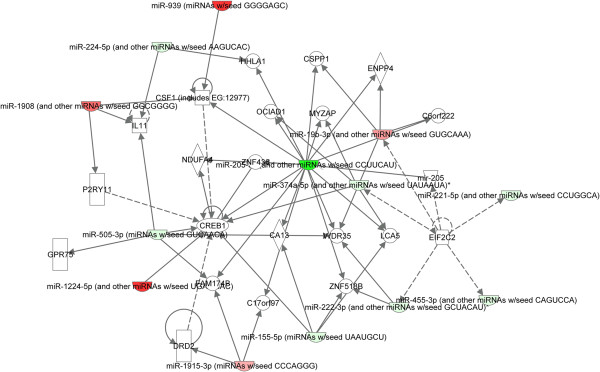
Ingenuity pathway network analysis of differentially expressed miRNAs. Depicting relationships among differentially expressed miRNAs in prostate cancer tissue compared with adjacent benign tissue (fold change ≥ 2, P< 0.05, virus miRNAs were excluded). Intensity of the red color indicates the degree of up-regulation. Intensity of the green color indicates the degree of down-regulation. Nodes are displayed using various shapes that represent the functional class of the gene product. Edges are displayed with various labels that describe the nature of relationship between the nodes: ___ represents direct relationship; ------- represents indirect relationship; →represents acts on.