
Figure 5.
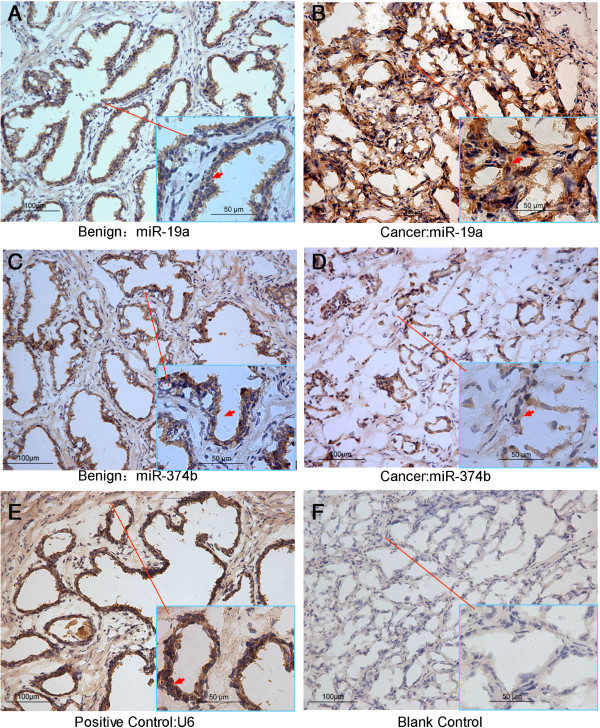
The representative in situ hybridization images of miRNA-374b and miR-19a. The miR-19a in-situ hybridization images in benign tissue (A) and cancer tissue (B); The miR-394b in-situ hybridization images in benign tissue (C) and cancer tissue (D); (E) is the positive control U6 RNA in-situ hybridization images and (F) is the blank control by replacing the RNA probe with PBS solution.