
Figure 7.
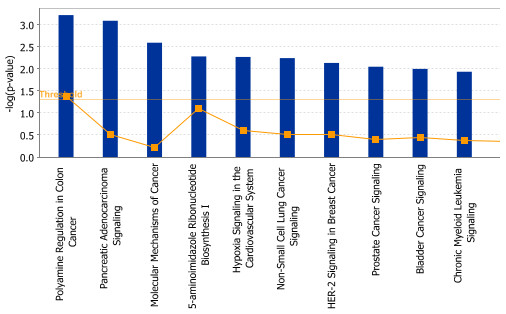
Pathway analysis for target genes of miR-374b. The 10 most significant canonical pathways across the entire dataset, and across multiple datasets, y-axis displays the significance. For the ratio, taller bars have more genes associated with the canonical pathway than shorter bars.