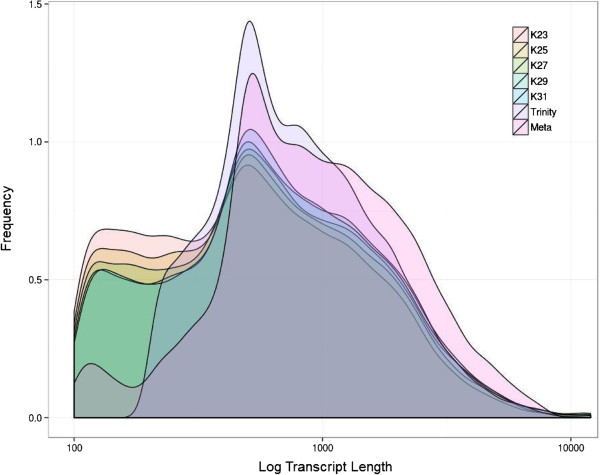
Figure 3.

Frequency distribution of transcript lengths by assembly. A plot of the quantity of transcripts with a given length per assembly shows differences in assembly output and a pronounced peak representing the median transcript length. The meta-assembly was generated by the re-assembly of all k-mer lengths using CAP3. Meta-assembly improved transcript length, as indicated by the leading edge of the graph. Meta-assembly also reduced the number of short contigs, compared to the single k-mer assemblies. Trinity automatically removes contigs smaller than 200 base pairs.
